Yesterday, I finally read Alberto Cairo’s short book “The Functional Art: An introduction to information graphics and visualization”. In my perception, Alberto Cairo is one of the guys at the forefront of shaping the field of information design – especially with his opinions on Twitter and his blog. He starts his book with the following sentence: “Recently someone asked me what personality trait best characterizes those interested in a career in visualization and infographics. My answer: ‘An insatiable, childish curiosity.’”
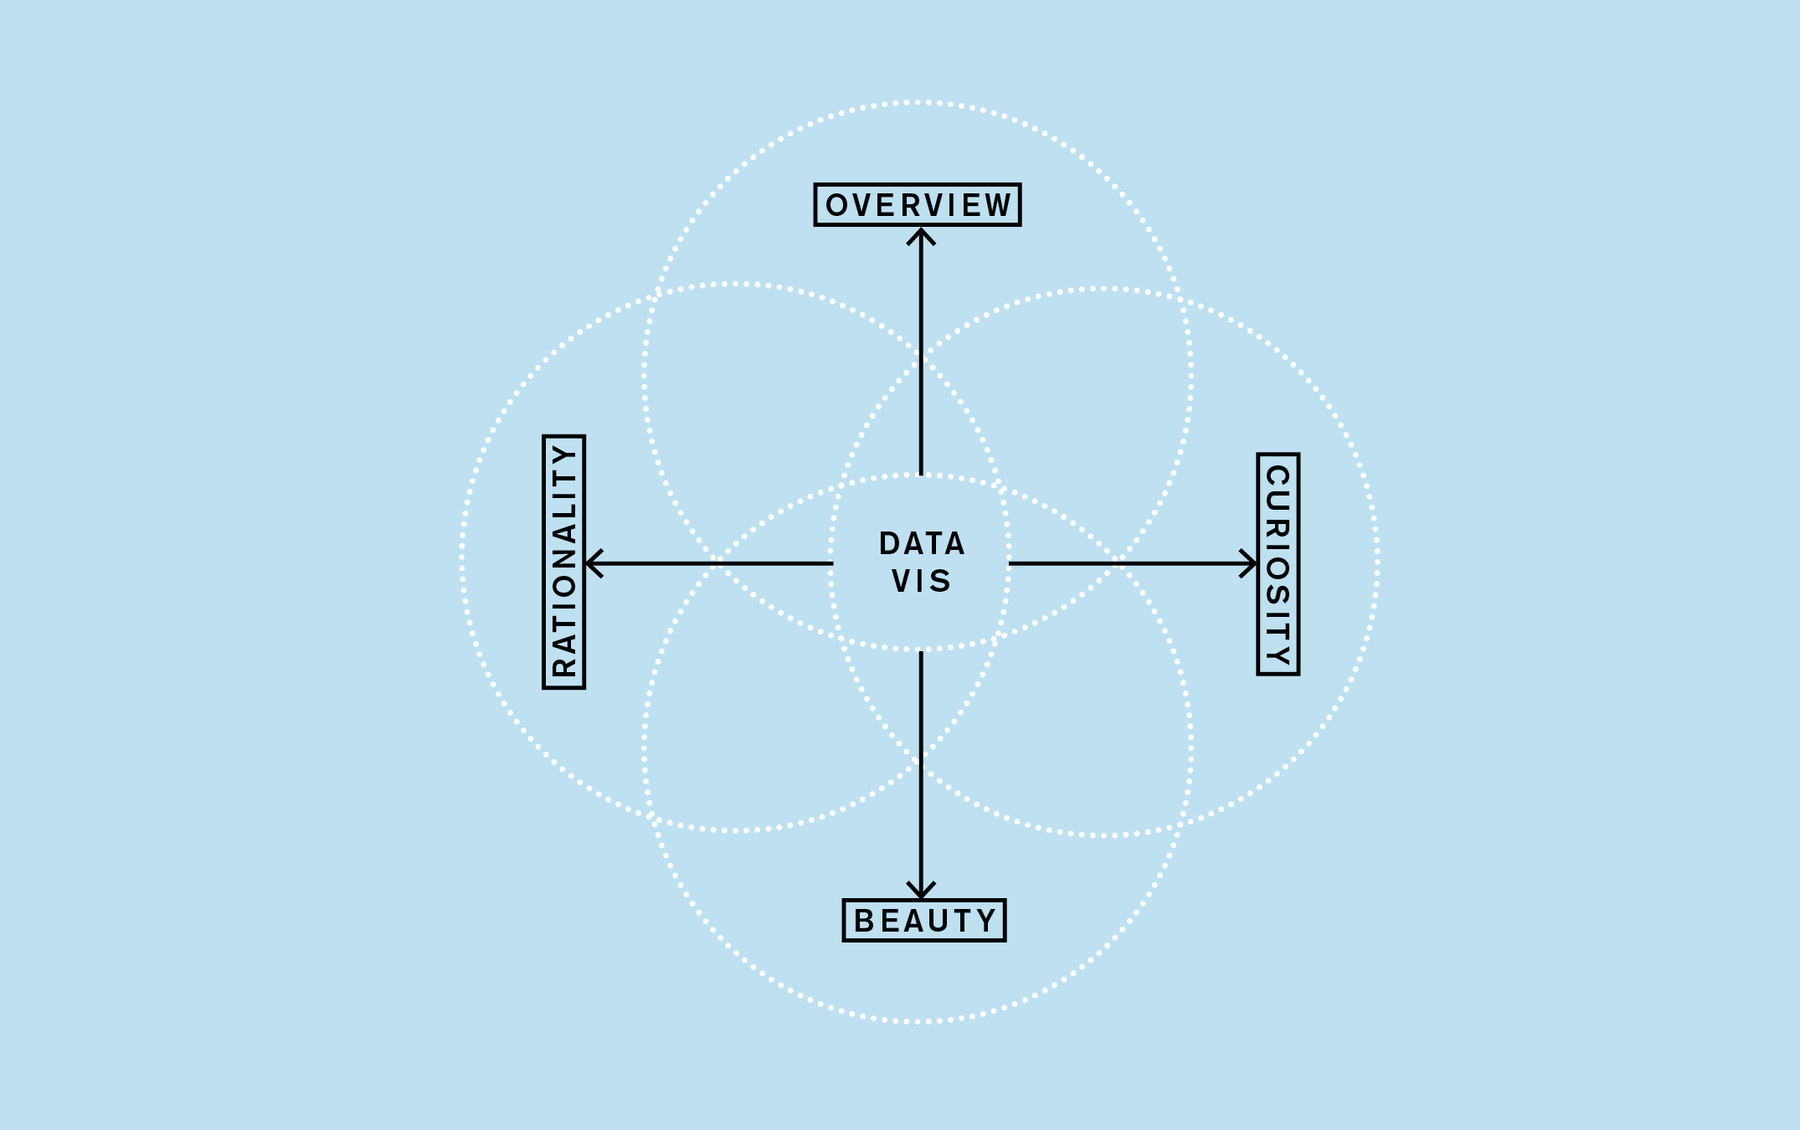
That is a strong answer and true for many people. But personally, it is not the main reason why I’m “interested in a career in visualization”. For me, the main reason is the drive for an overview. Further reasons are, indeed, curiosity, but also creating beauty and being rational. I will explain them all after defining what these personality traits actually are.
Overview, beauty, curiosity and rationality are all personal values. You know that you discovered a personal value of yours when you’re doing something and you’re imaginative friend starts asking you: “Why are you doing this?”. And then he poses the same question when hearing your answer. And he won’t stop doing this till your answer is “As an end in itself”. Your answer before that last answer – that’s a value of yours.
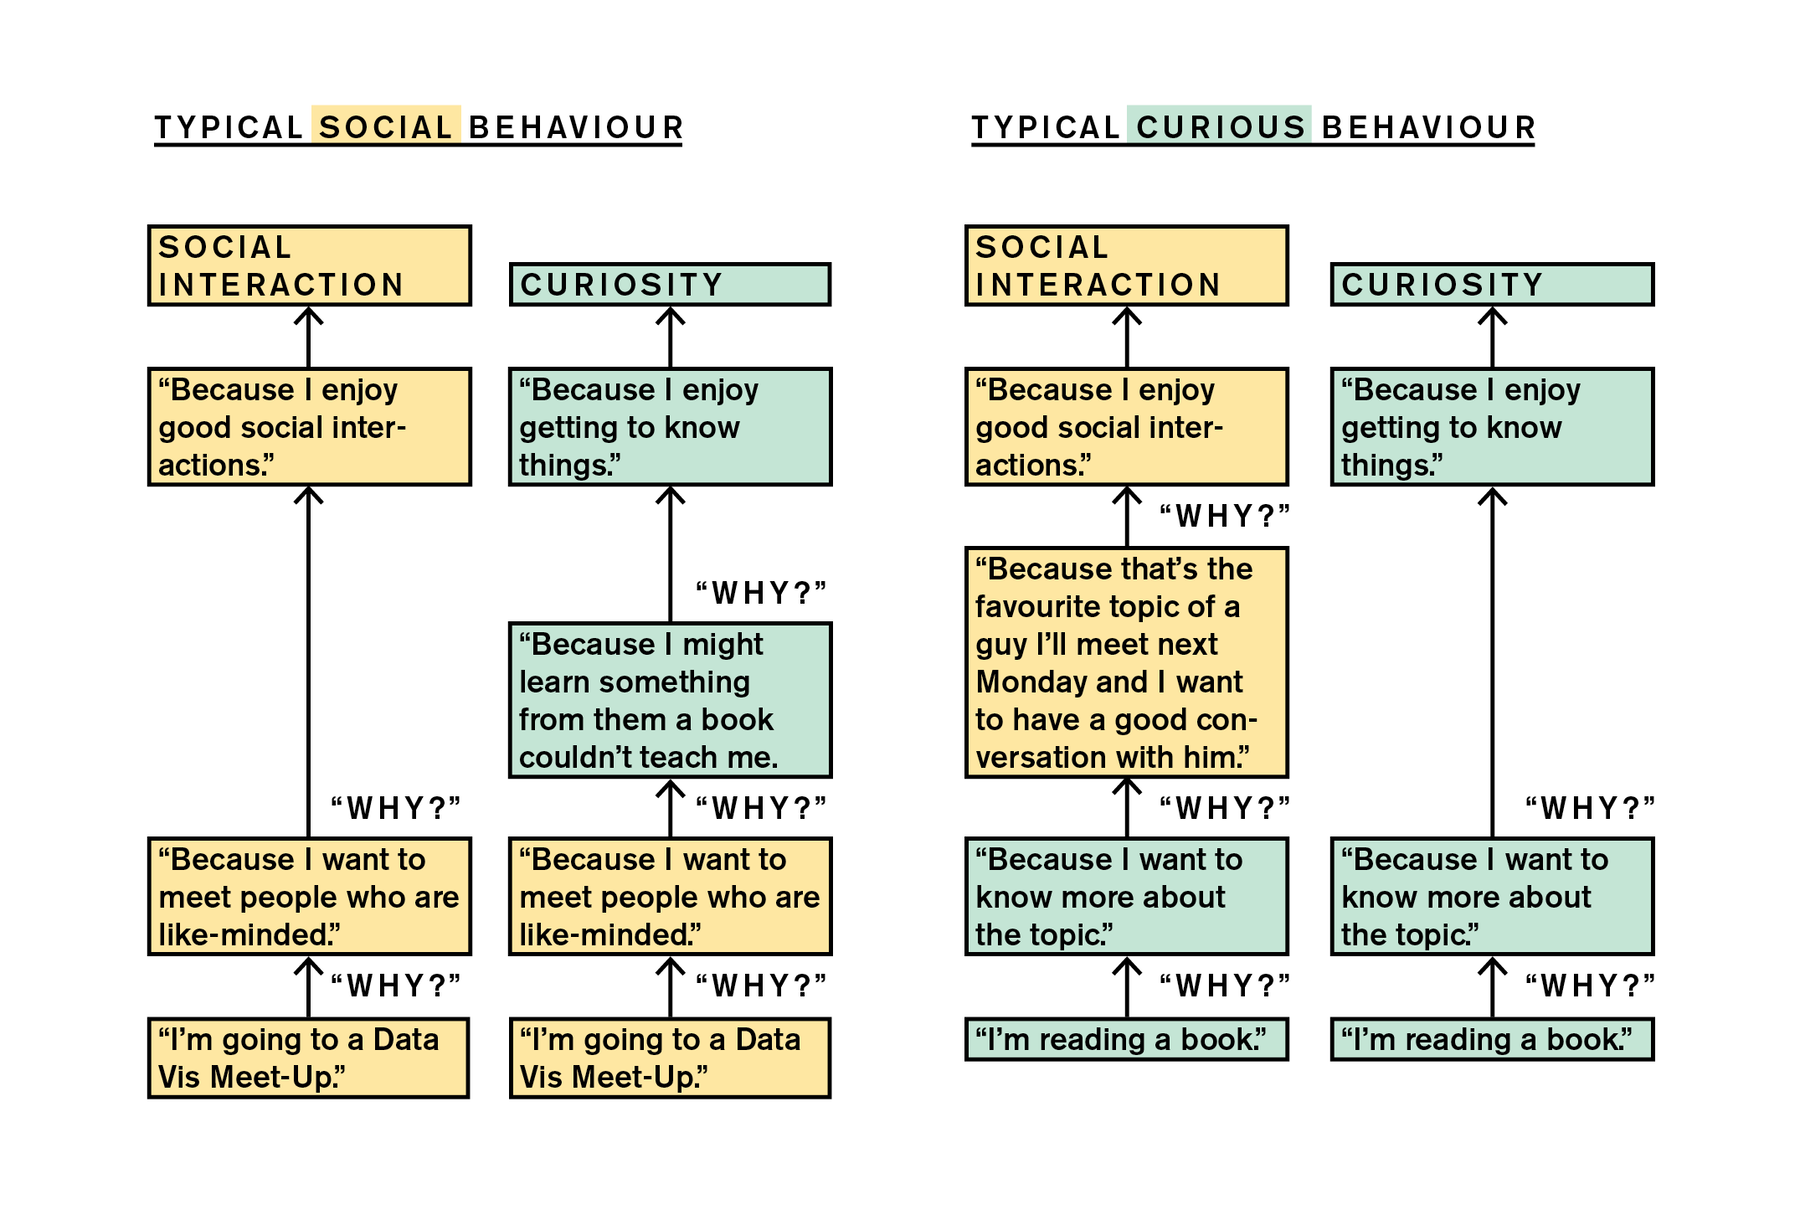
Let’s compare the hugely social person A (on the left side in both examples) and the very curious person B (on the right) for an example. What is their main reason to do two simple actions – going to a meet-up and reading a book? You might think that a person who goes to a meet-up does that because of his social need. And reading a book obviously satisfies curiosity. But the main reason to go to a meet-up for a not-so-social, introvert but very curious person might be the fact that people can teach him more or other things than books can. This person will enjoy the meet-up a lot, but not because of his social needs, but because he’s happy about how much he has learned. We see: People are doing the same things because of different values.
People are also in data vis because of different values the hold high. For Alberto Cairo, it might be the curiosity. For me, it’s the overview. Alberto and I will deal differently with data visualization because of our different combinations of different values (and because of our education, cultures, mentors, job experience etc.). And even if people have the same combination of values, they might not even be landed in data vis, but in another discipline. But I did land in data vis, and I will explain my combination of values here:
Overview/Order
My life would be different if I wouldn’t love overviews as much as I do. I prefer to have only a few things in my life: I throw away stuff quite regularly. It scares me when I see a box in my flat and don’t know the content until I check it. I prefer to live in a 1-room-apartment instead of a 2-room-apartment so that I can keep the overview over all the things I own. Overviews start with sorting. I want to sort everything: My life (I like monthly calendars, but love year planners), my thoughts (Workflowy – a giant list with infinite hierarchies – is my favorite tool), my todos (I couldn’t find the perfect tool yet).
What does that mean for my data vis projects? I want to give myself (and the reader) an overview about what’s happening in the world, the facts we have about what’s happening, how something works. And I want to sort numbers. I almost literally get a smile on my face every time I click the “sort” button in Excel. It makes me feel good. And I like maps.
Curiosity
That doesn’t need to get explained so much: Curiosity means reading and stuff. I want to understand the world. I want to get surprised. Alberto can tell you more about that - he should be our all role model regarding the number of books he reads per year.
What does that mean for my data vis projects? In my opinion, every single topic is interesting. If I just go deep enough into it, I will find things that astonish me – that is a fact. I studied visual communication and therefore decided for an university subject that focuses on how to create the form instead of the content. And I chose so because I couldn’t decide which content I want to study. Now I can study all the topics that my clients or I are interested in, and I’m very often very grateful for these many insights into other fields. As somebody who gives these insights a form, I want to get other people interested in them – even if they don’t share this general interest in all fields that I have. For me, that means a lot of asking “What could the viewer/reader be interested in?” instead of “What is possible?” (as a not-so-curious, but great programmer would ask – and which is also important).
Creating Beauty
Sometimes, I like to look at beautiful pictures. My drive for beauty was especially strong in the first nineteen years of my life: I drew illustrations daily, until I had hundreds of them. I’m not doing this anymore. I still choose the more expensive item above a less expensive item, if the only feature is that it’s more beautiful. It’s important for me that my environment is beautiful (as I define it): My flat, my house, my street, my neighborhood. And I studied six years long, among others, how to make things beautiful. “Creating” means, I don’t just want to look at beauty (like an art history student is satisfied with); I want to throw new beauty on the world.
What does that mean for my data vis projects? I’m approaching – and always will approach – data vis from the designer perspective instead of e.g. the computer science perspective. That means identity-building, context-building, value-building; all with the help of design and all to a different extent in each project. Beauty can make things more functional. I’m not the biggest advocate of beauty (because it conflicts with the next value I’ll explain), but this is a fact I can’t deny. Besides from designing the data, the data itself seems to be quite good-looking for some people like David McCandless: Information Is Beautiful). For me and others, data is an explanation why our work looks the way it does – a seemingly rational, but actual hypocritical explanation.
Rationality/Sense-Making
The more I live in this particular era in this particular part of the world (and the more I read about it), the more I notice how much it defines me. My education (meaning, my culture, school, books etc.) told me that science, logic, rationality are good and everything else is dubious. They told me that everything has a reason and often a consequence, too. That everything makes sense, especially in nature, but maybe even in society, law, economics, politics. That they are rules. So here I am, believing that all, like millions of other people – although sometimes I think that, sadly, I believe it a little bit more than the average.
What does that mean for data vis projects? Everybody who works with data gets pleased when they find a correlation – a possible proof for a causality! How exciting! We look at data and are glad when it’s clean and tidy and doesn’t have too many outliers. Because outliers don’t make sense. And they are not a proof for a rule. Like everybody else, I am on the search for patterns, and will emphasize them once I found them.
As mentioned before, our focus on values is not the only thing that influences our work. I am, for example, very much influenced by my way of working: I hold efficiency very high (which also sometimes conflicts with my value “beauty”, because true beauty takes time – sometimes spent inefficiently). But personally, it helps me to keep in mind the values my motivation for data vis is coming from. Every value defines who we are, but comes with potential downsides, too. If we know the values, we can see our strengths and weaknesses. We can also recognize these patterns in other people. And I told you: I just like sorting stuff.
Comments